5 New Charts: ARR, MRR, Active Subscribers, Auto Renew Status & Cohorted Proceeds
Everything subscription app developers need to analyze ARR, MRR, subscriber retention, and revenue cohorts is now all available in Superwall's charts.
Starting today, we've shipped five new powerful charts to help you keep tabs on your app's growth, overall health and subscriber movement:
- ARR (Annual Recurring Revenue) shows you exactly how much yearly revenue your app would pull in if all your current subscribers kept their subscriptions running.
- MRR (Monthly Recurring Revenue) represents how much revenue is generated each month from active subscriptions.
- Active Subscriptions tracks the count of unexpired, paid subscriptions at any point in time.
- Auto Renew Status shows how much of your MRR is set to renew vs churn.
- Cohorted Proceeds represents net proceeds cohorted by install date — after refunds, taxes, and fees.
Like our existing charts, each of these support our powerful filters, breakdown segments, time ranges, and natural language input for data selections. That means you can answer questions like:
- How much of my ARR comes from a particular paywall, but only in the United States?
- How much MRR comes from a certain product?
- Was my ad spend profitable for a certain day after refunds and Apple's commission factor in?
Let's check them out.
ARR
Being able to see your revenue at a yearly clip is essential information. You can think of it as your app's annual earning power right now.
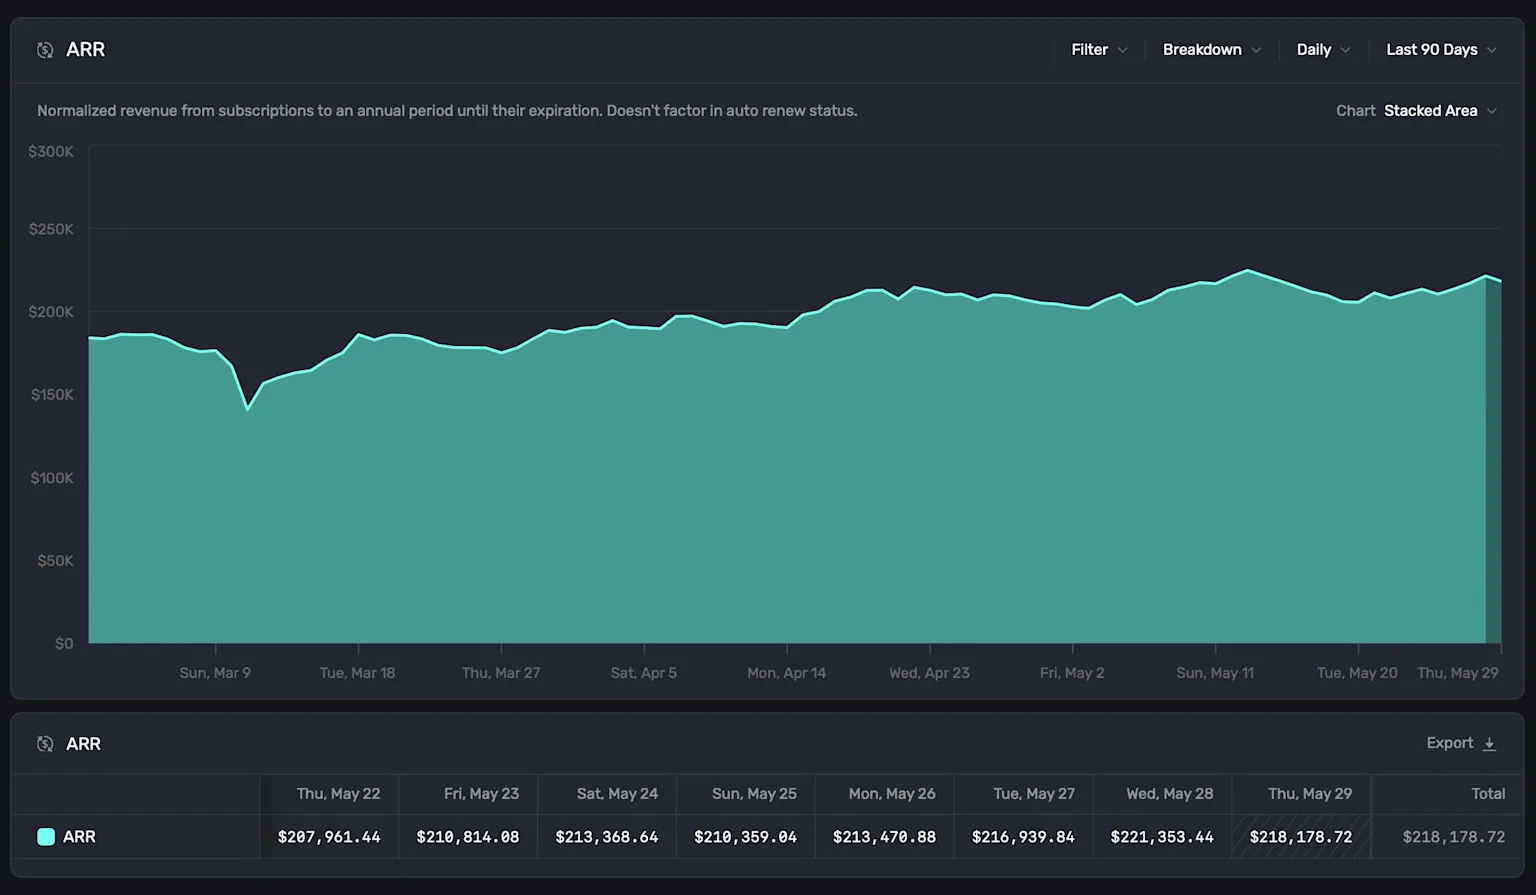
Here's a pro tip: You can breakdown our ARR, MRR and Active Subscriptions charts by "Auto Renew Status", making it easy to see how much of your revenue and subscriber base is actually set to automatically renew versus how much is going to churn when the current billing cycle ends.
Most analytics focus on total numbers, but using the auto-renew breakdown with those charts gives you the delta between your current performance and your future performance. Instead of simply knowing "we have 1,000 subscribers," you can see the full, realistic picture: "700 subscribers will stick around, and 300 are about to churn."
For example:
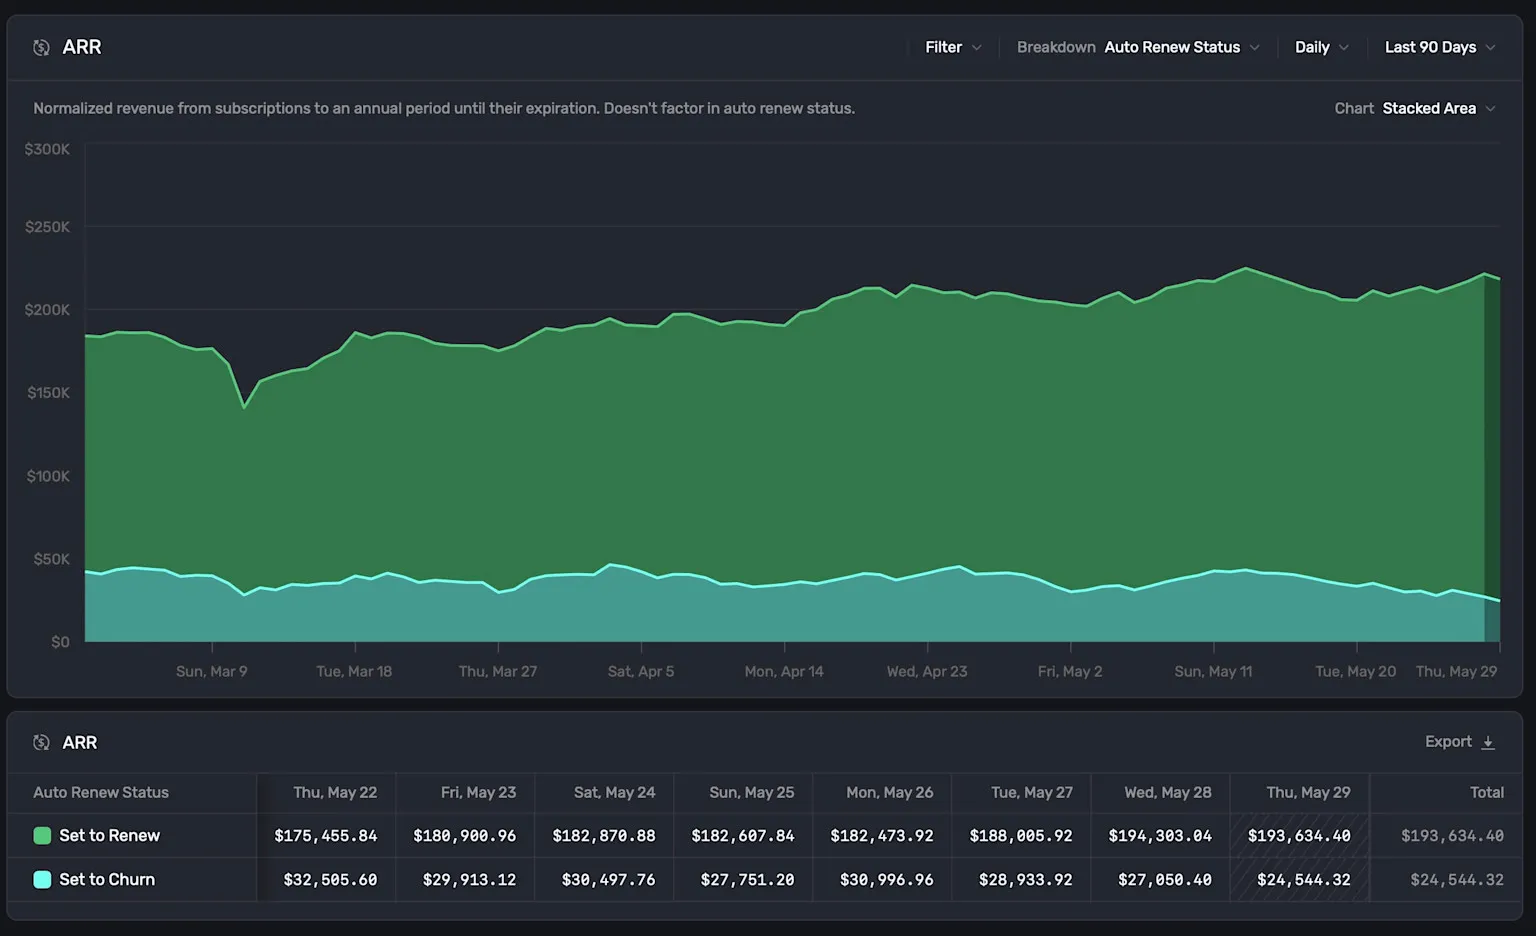
MRR
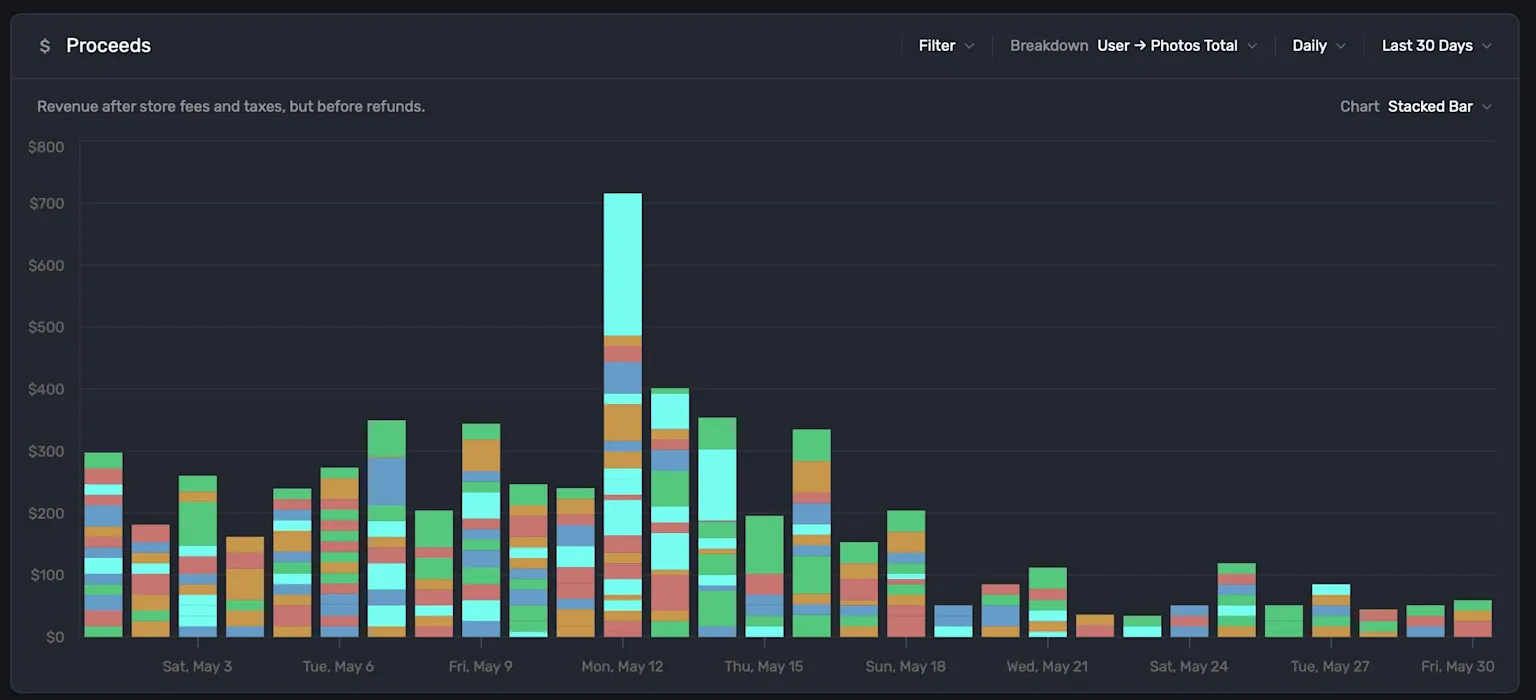
MRR is great for snapshotting your monthly subscription income, helping you track growth trends and momentum.
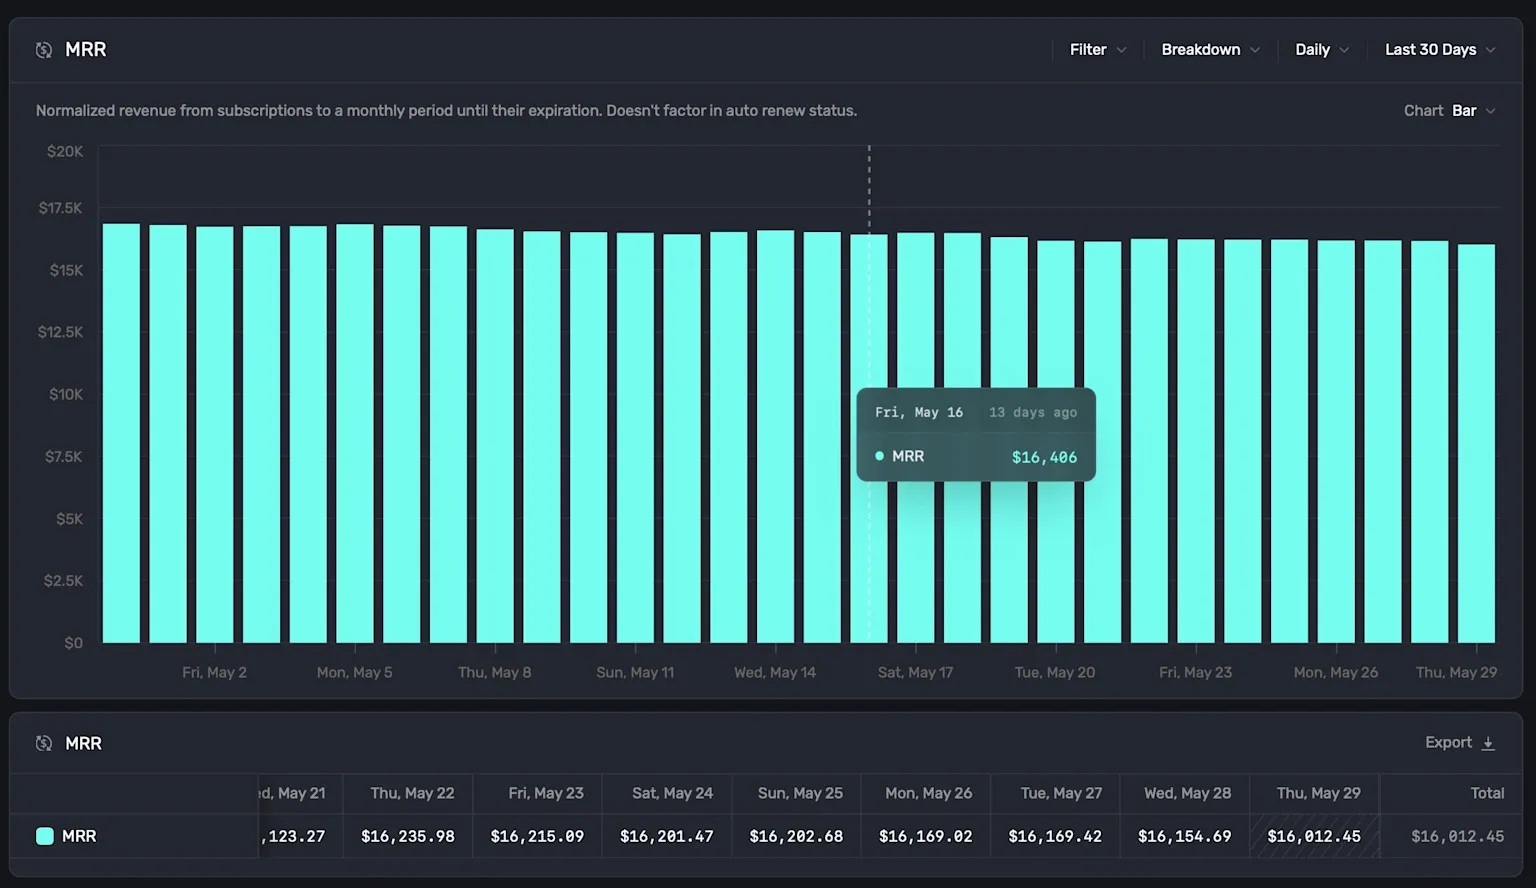
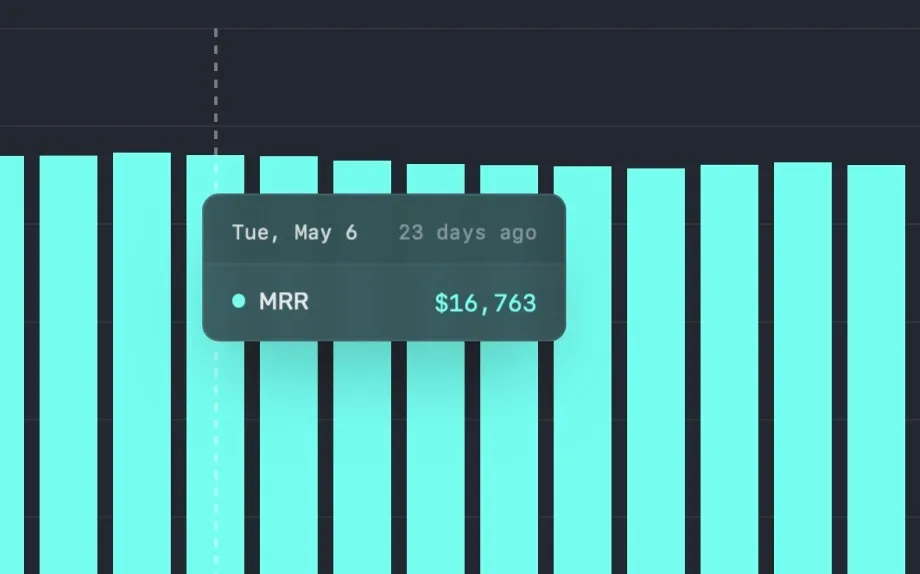
Remember, you can always change the display of our charts, too. Here, I went with a bar chart. Plus, you can always hover over a segment to get more details about the data:
Here's another gamechanger in our revenue-based charts — you can break data down by user attributes. This means anything you've set as an attribute is available to slice data with in our charts. In this camera app, we could see how revenue directly correlates to the number of photo attempts taken:
Active Subscriptions
This chart shows you exactly how many users currently are on an active plan or subscription, giving you a clear snapshot of your subscriber base regardless of whether they're set to renew or churn.
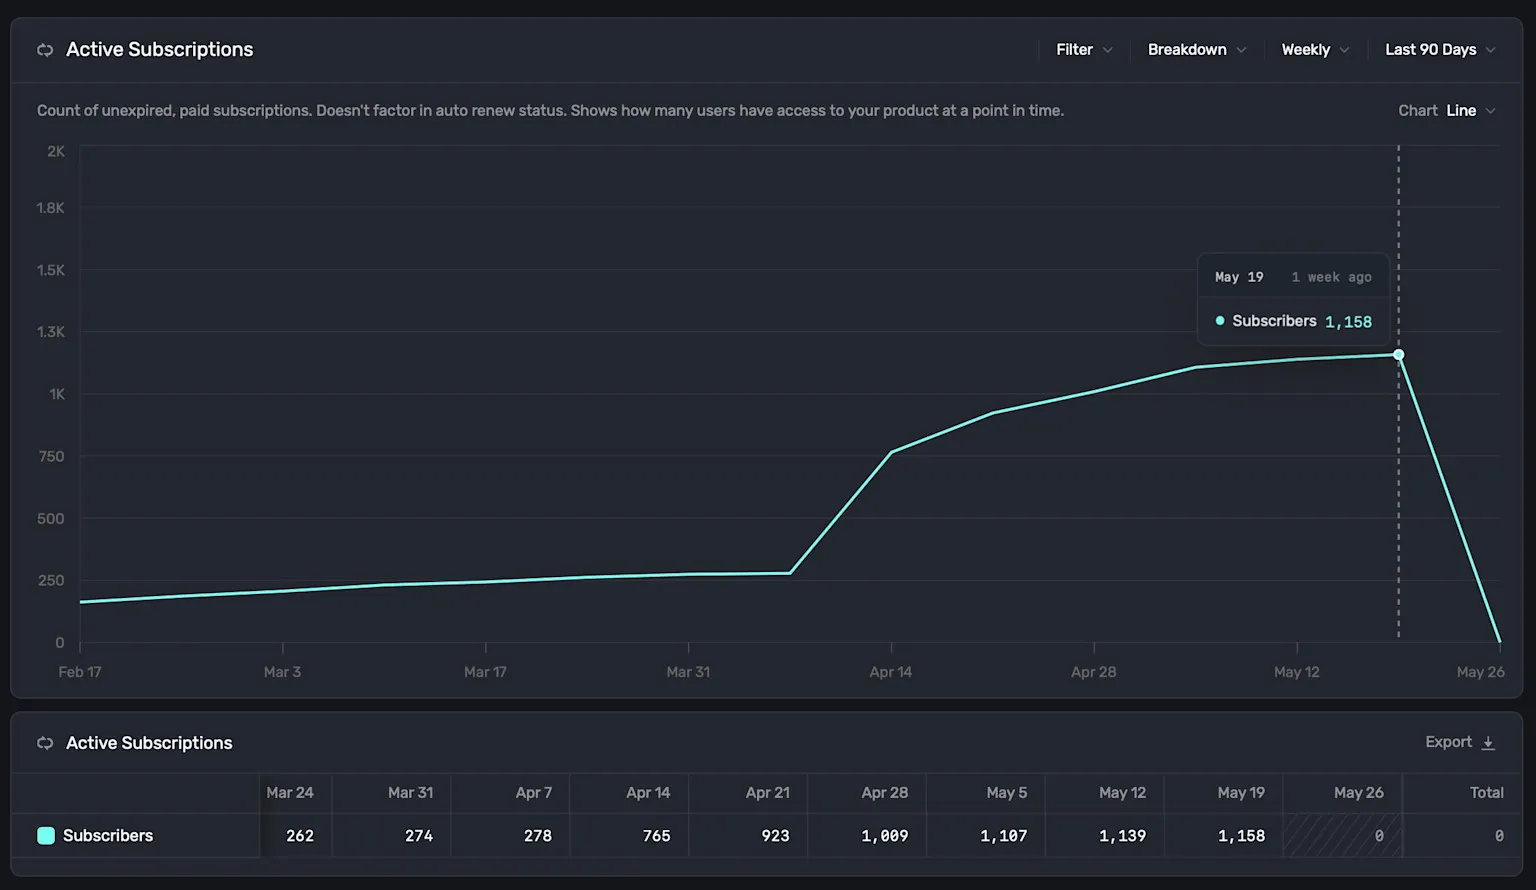
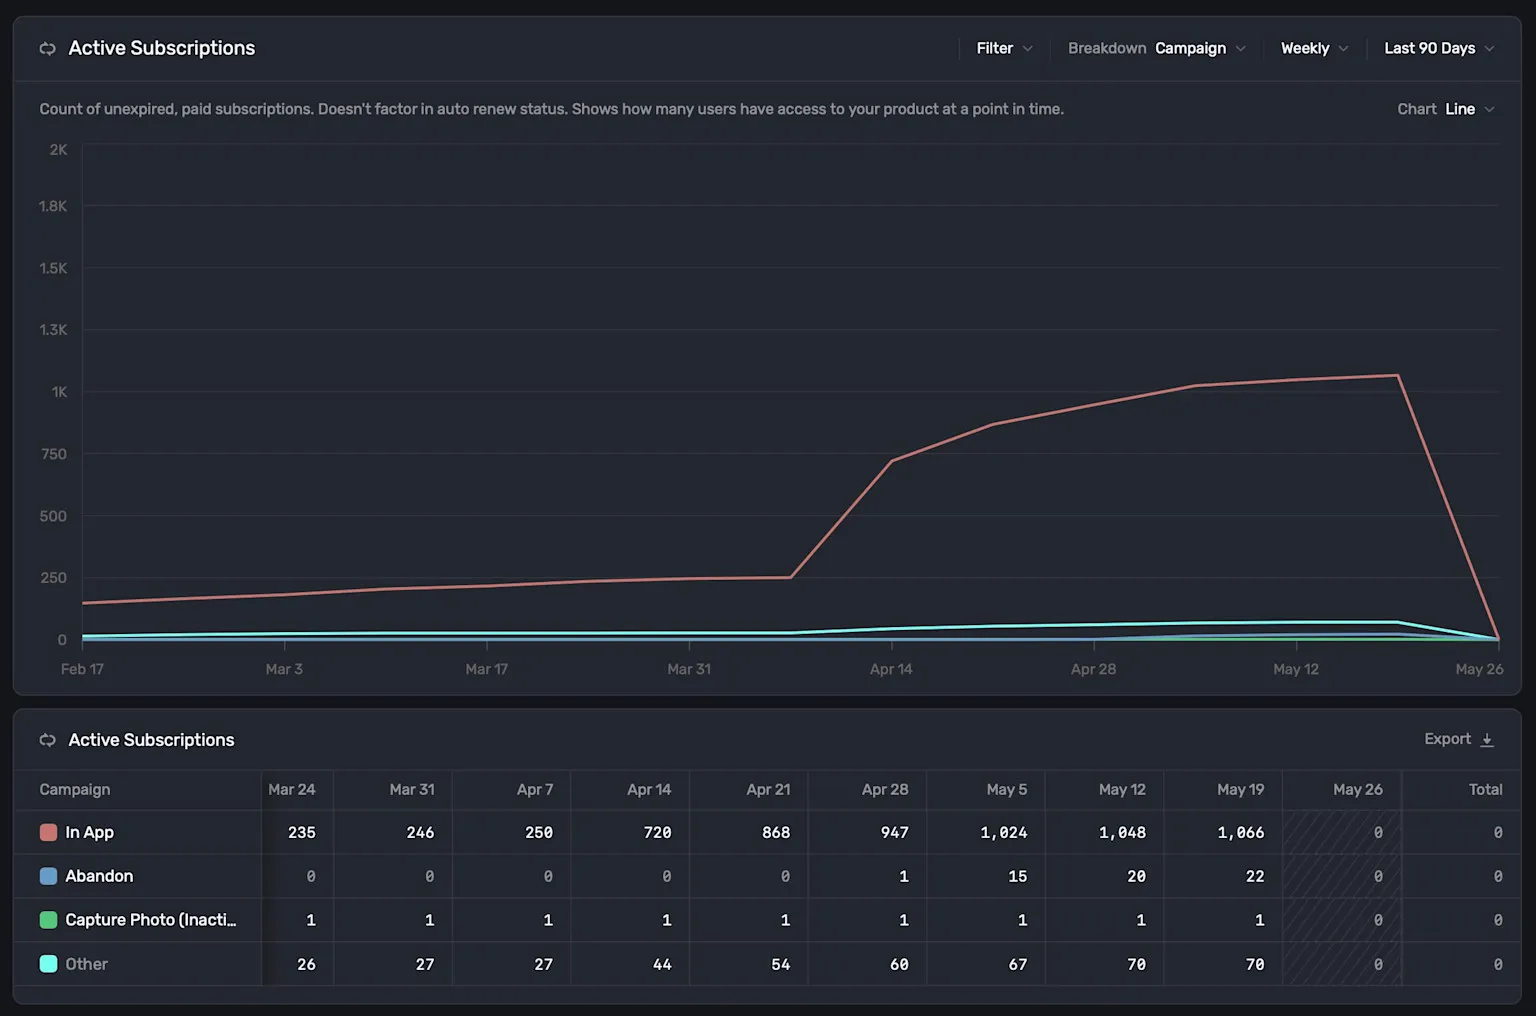
I love tracking subscription growth over time with this one, especially at an annual cadence (i.e. this time last year I had X active subscribers, now I have Y). Another great way to use this one? In conjunction with Superwall's campaigns, which gives you a nice overview of which campaign is, quite literally, producing paying users:
Auto Renew Status
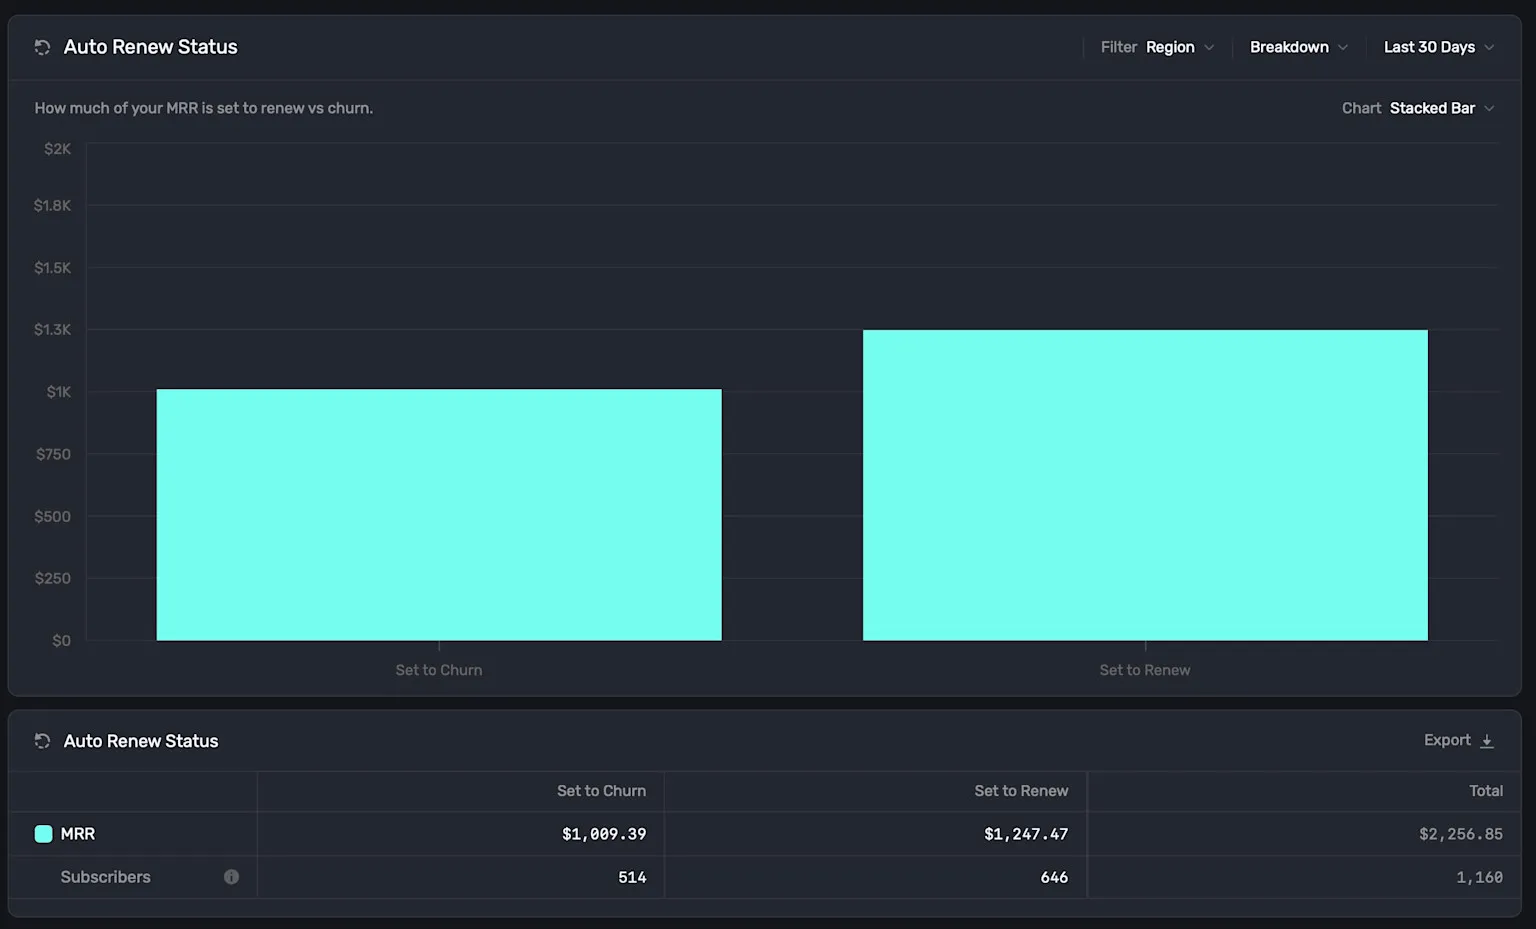
How many people are staying, and how many are set to churn? This breakdown is crucial for understanding which portion of your MRR revenue is at risk, which can help you focus retention efforts where they'll have the biggest impact. On the other hand, you're also getting a snapshot of how well you are retaining paying users. I personally like viewing this one using our stacked bar chart:
Cohorted Proceeds
And finally, we've added Cohorted Proceeds charts. This one is ideal for comparing against your ad spend to calculate true ROI, helping you understand how much revenue each user cohort is actually generating for your business.
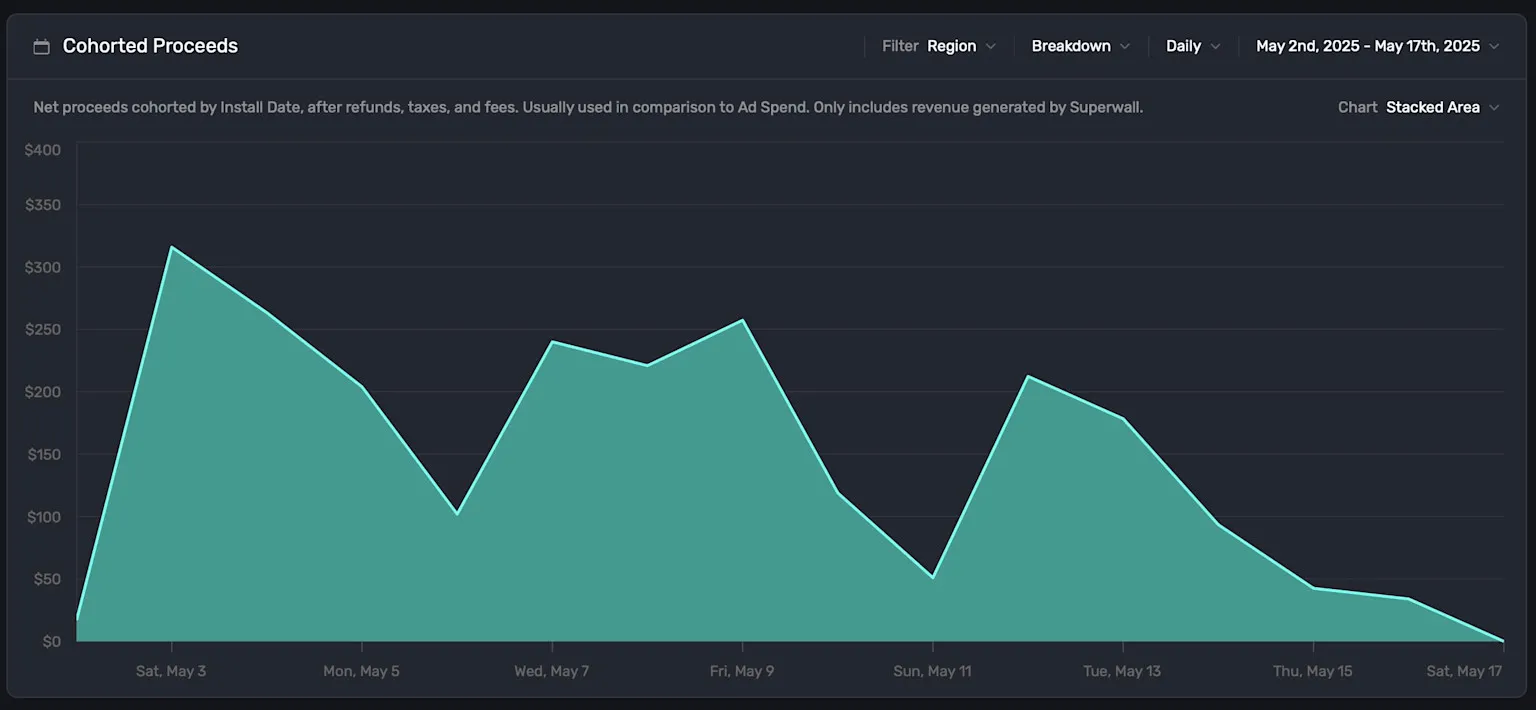
For example, on May 3rd, ad spend was increased. So, was it worth it? Looking at this chart, you can answer that kind of question.
Go try out these new charts, for free, today
And, the best part? These charts are available for every Superwall user. You shouldn't have to pay for data and insights, and with us — you don't. To get started, go set up with our no-code revenue tracking if you haven't yet, and install our SDK to get the most in-depth insights.